NBA In Game Win Probability
Bear with me for a second. I’ve get pretty stressed out when watching the Denver Broncos play. Part of my routine involves finding the in game win probability chart so that I know when I should just walk away from the game (good or bad). I also always have trouble finding these charts online, a couple of these sites like Advanced NFL Stats have slowly stopped or broken down over the years. So I figure I should make one myself!
This is right around the time that the Warriors were on their run for a second title with Steph Curry, so I thought I would start with basketball first. It seems a lot more straightforward because there are a lot more scoring events and the data was much much easier to get my hands on, thanks to Michael Beuoy for pointing me in the right spot.
My first approach is to look back at previous situations and find out how likely you were to win in that situation. The “situation” was defined by what the difference in score was and the time remaining (aligned to 10 second bins). This produced results which seemed pretty good. Someday I’ll ressurect them and see if I can make some charts.
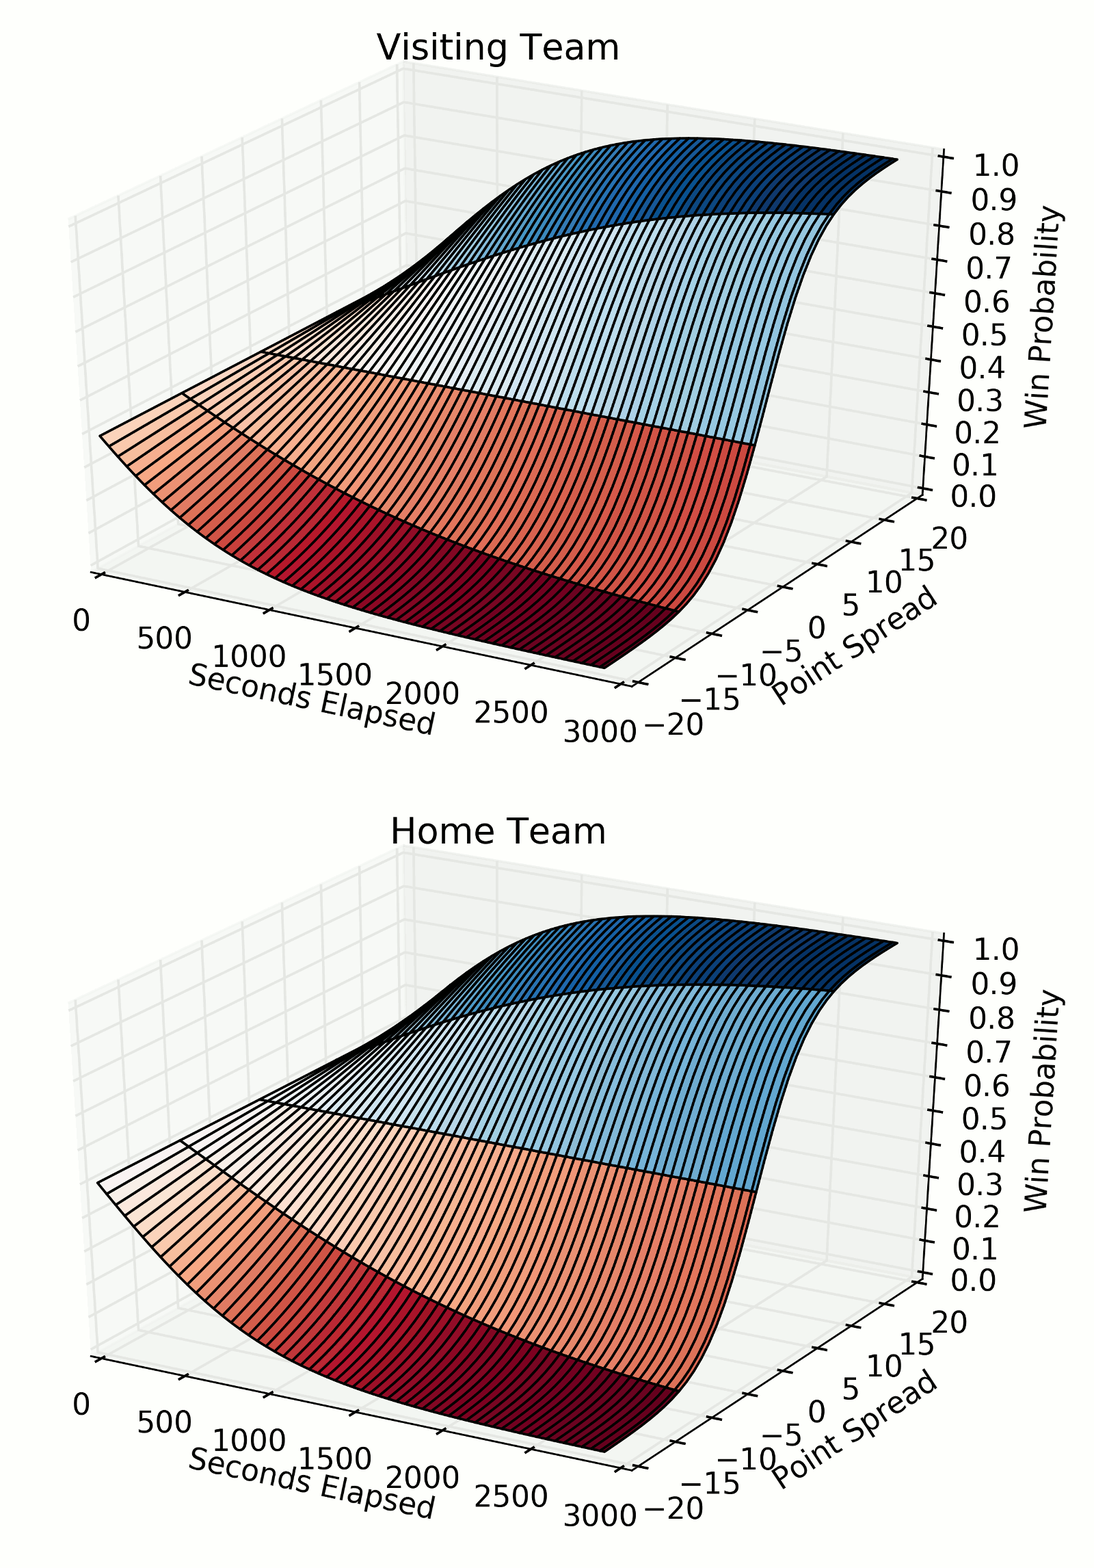
The second approach was to use a Logit GLM to fit a variety of data. I included home vs away, score differential, whether or not you currently possess the ball, and percentage of the game which had been completed. After my wife showed me that I should use the logit and how to convert that set of constants into a formula that produces a probability, we got this:
$$y = e^{-(0.2775 - 0.4483 \cdot A + 0.3208 \cdot T \cdot S + 0.2894 \cdot P)}$$ $$Probability = 1 / (1 + y)$$
A = 1 if you are the away team, 0 if you are the home team.
T = Percentage of time remaining, from 0 to 1.
S = Score differential, your team’s score - the other team.
P = 1 if you possess the ball, 0 if you don’t possess the ball.
I also tried some variations where ignore possession and produced some nice 3D plots.

In future iterations I hope to wire up a website that will produce these charts on demand, for past games or games which are currently being played. Some improvements I’d like to make eventually are:
- Overtime - Right now I don’t include any overtime states in the model.
- End Game - The model doesn’t take into account that if you have possession, are leading, and there is < $SHOT_CLOCK_TIME remaining, then you’ve basically won. The model underestimates your chances of winning in these scenarios.
- On demand charts for past games and currently active games.
I’m also going to eventually take a crack at doing this for the NFL.
The preview image for this post can be found here.